It is an extraordinary paradox of modern strategy that after a century of almost continual global conflict, the United States still budgets, builds, and mans its military on a peacetime concept that predates the First World War. The nation spends like a warring power but builds like a peaceful one. For decades, a comforting myth has quieted anxieties in Washington: the assumption that if a peer conflict ever erupts in the Pacific, America can simply reactivate the slumbering industrial muscle of its historic "Arsenal of Democracy". This is a dangerous mathematical delusion. A cold diagnostic of contemporary shipbuilding capacity reveals that the physical foundation required to surge, crew, and arm a modern fleet has not merely decayed—it has been systematically dismantled.
America’s military power is in decline while China’s rises, and the gap is widening fastest in the domain a maritime contest turns on: the USN can’t build, can’t crew, can’t repair, and can’t arm its fleet at a sufficient level to meet the demand for war in Iran let alone Asia.
The United States is being overmatched by China in every category.
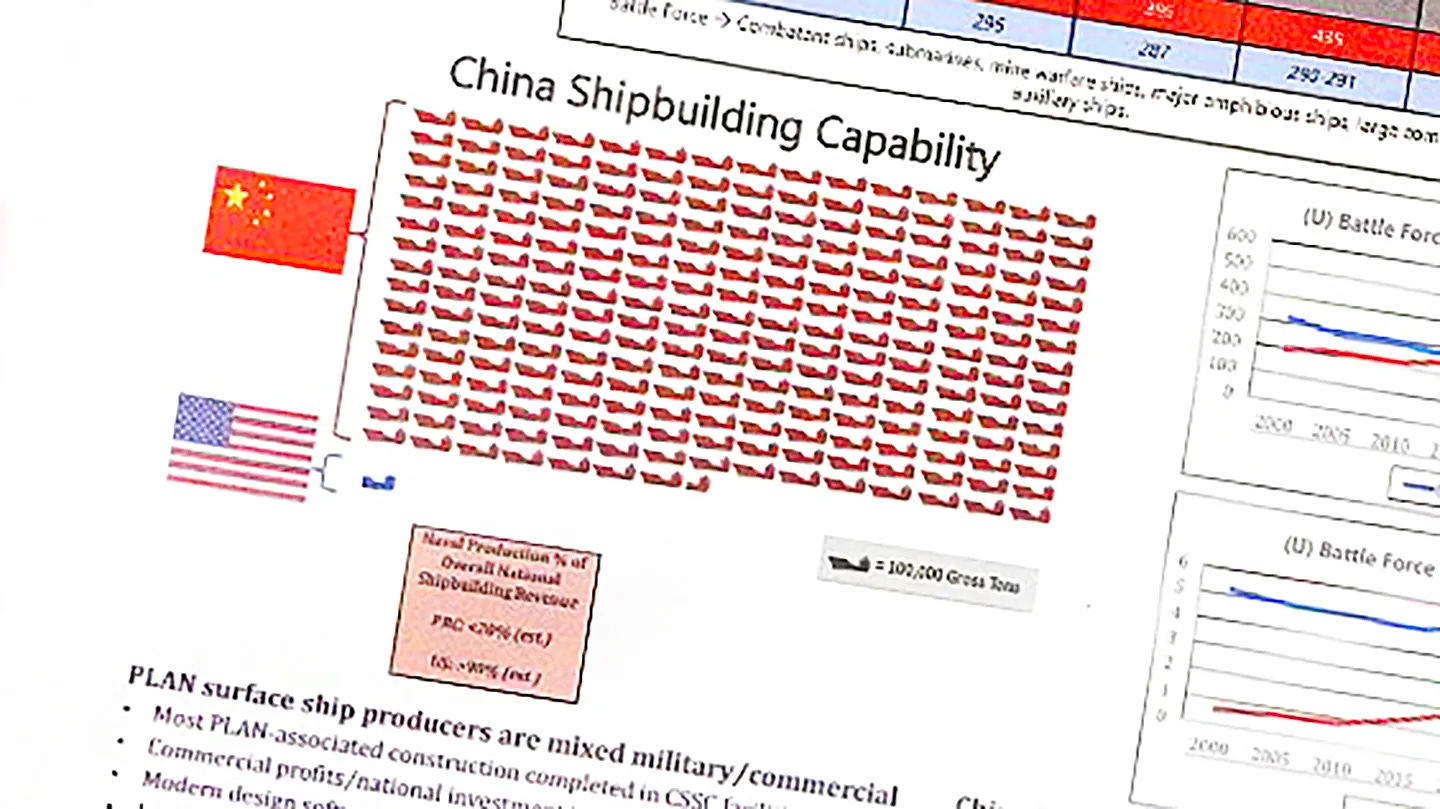
“One Chinese Shipyard can produce more ships in a year than all of ours combined.”
Brigadier General Mark Clingan, USMC, 2023.
“China has 13 naval shipyards, with one of these facilities having more capacity than all seven US naval shipyards combined.”
Navy Secretary Carlos Del Toro, 2023.
The Office of Naval Intelligence put the disparity in raw shipbuilding capacity at more than 200 to one by tonnage.
The 6 remaining open shipyards cannot close the gap. Clingan’s diagnosis was that procurement had been “optimized for the 1990s” meaning the peace-dividend period, and that “our production may not be sufficient for the future conflict”. Which is putting it exceedingly diplomatically. Having divested for years, America can spend as much as it wants, but that will not change the fact that it is completely unable surge to meet the demands of the future, the way it has in the past.
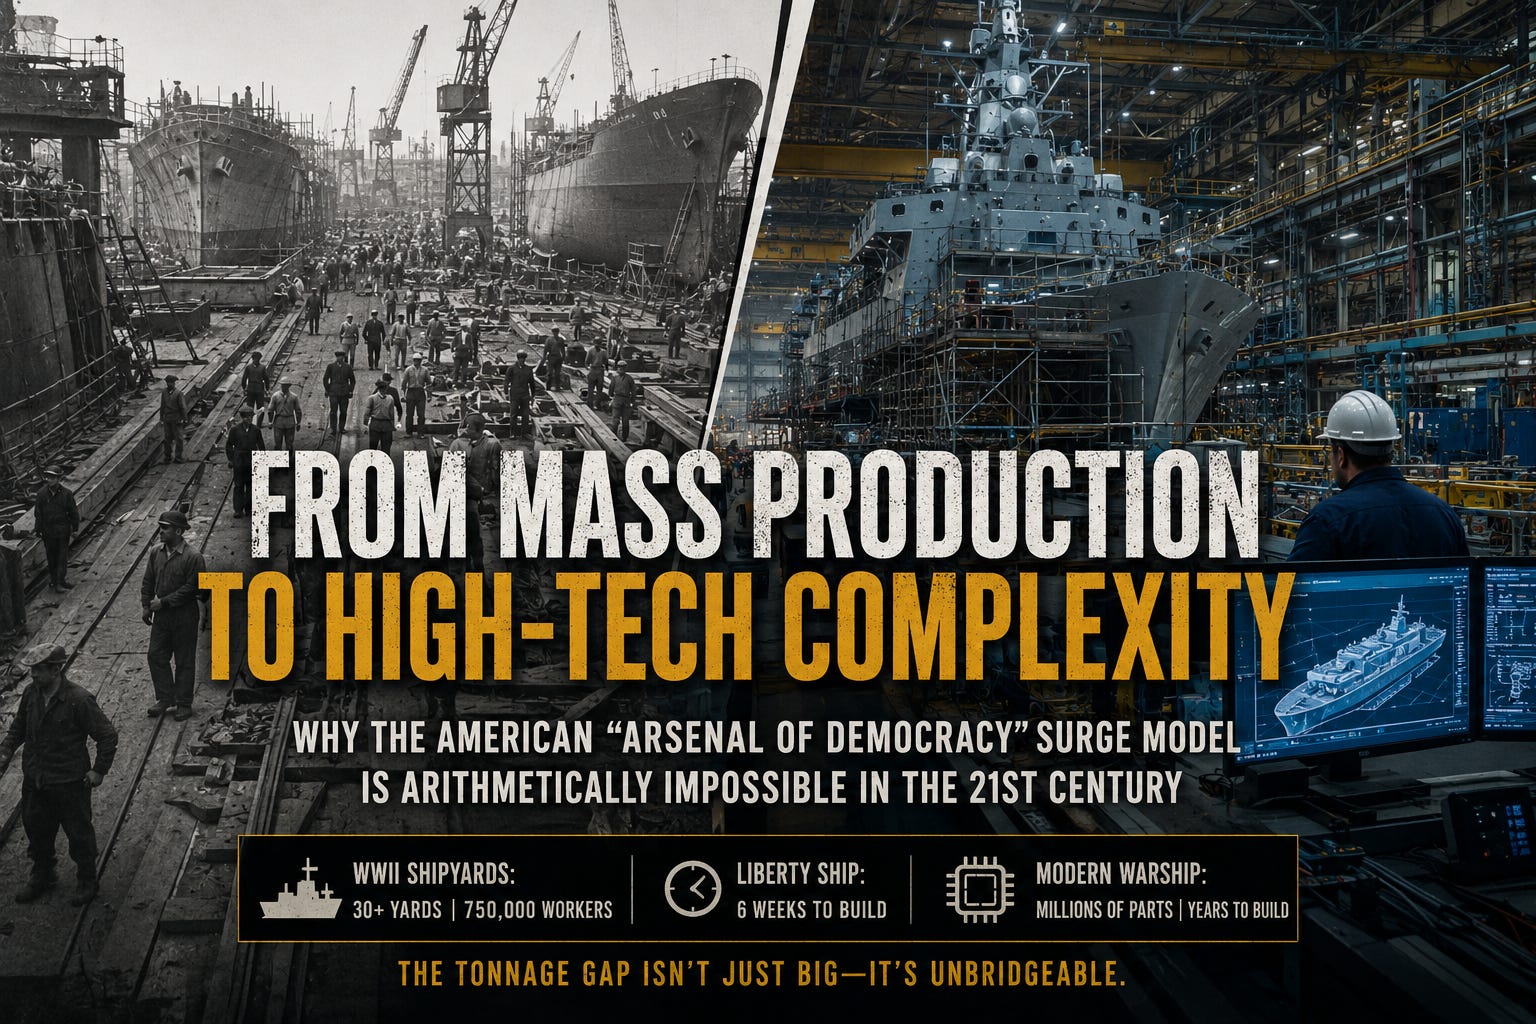
The Tonnage Chasm: 1940 vs. Today
The reason the Second World War surge model offers no comfort is multifold. Industry, society, workforce, education, technology, government spending, and military platforms of the 2020s are unrecognizable from the 1940s. For example, a Liberty ship was engineered to be simple — standardized so inexperienced yards could build one in about six weeks, and nearly 2,700 were turned out by workers trained in a matter of weeks. That was the design goal: a hull built faster than it could be sunk.
A Second World War warship was built by perhaps a dozen heavy trades — shipfitters and welders, riveters and burners, pipefitters, machinists, electricians, sheet-metal workers and boilermakers. Almost all of them were metalworking and assembly crafts, and the decisive one, welding, could be taught to an unemployed person in a matter of weeks. The ship was hull, propulsion, guns, and basic wiring, and the trades list matched it. A welder drawn from a lingering depression era bread line in the spring of 1941 was laying production seams by the autumn.
In the war, American shipbuilding employed over 750,000 people in over 30 shipyards capable of building large ocean going ships. The result? That stimulus ended the great depression once and for all. In a few years, the United States quickly became the arsenal of democracy, churning out unimaginable numbers of military platforms.
US Army Air Force Bombers (heavy to light): ~96,9004
Munitions
US aerial bomb expenditure, strategic campaign alone: over 1.2 million tons (1,050,710 tons on Germany + 179,967 tons on Japan, USAAF strategic bombing). 5
Total across all theaters including tactical and naval air was higher still.
This kind of output is simply impossible todayunder any circumstances.
A modern warship, submarine, fighter or missile is best thought of as orders of magnitude more complex than its 1940s counterpart—roughly a hundred to a thousand times—because a WWII platform was an essentially mechanical machine with guns. The old metal trades remain — but the welding is now certified to tolerances a Liberty ship never met — and on top of them the ship demands combat-system integration technicians, radar and sensor installers, fiber-optic routers and terminators, network and software technicians, gas-turbine propulsion specialists, nondestructive-testing inspectors, and damage-control and survivability fitters. The hull is the small part; the ship is a combat system with steel wrapped around it, and the trades list is electronic and digital as much as it is metal.
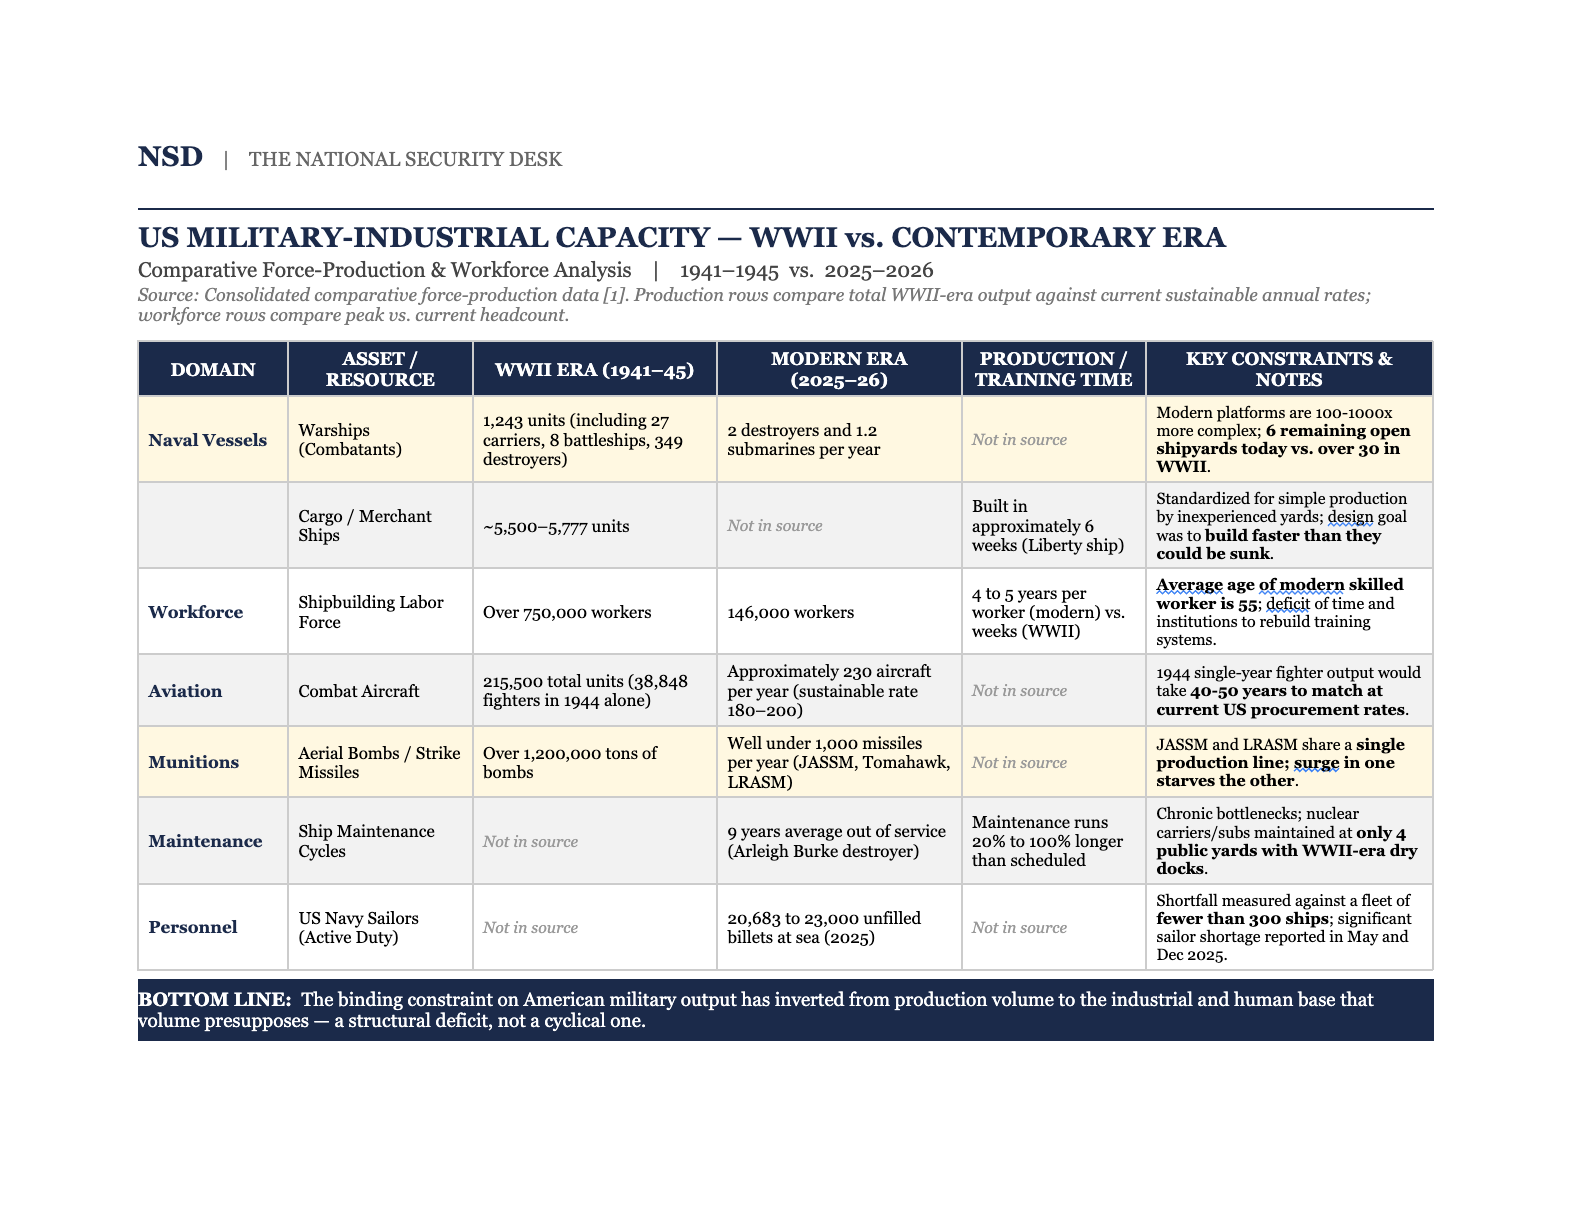
The country that mass produced 5500 merchant ships, 1243 combatants, and 215,500 combat aircraft in 5 short years, can at best, commission 2 destroyers and 1.2 submarines a year today. In 1944, the country built more fighters in a single year than it will now build in roughly forty to fifty years at the current rate.6
The Demographics of Atrophy
Today 146,000 workers (down from 218,000 as recently as 1981) service just six shipyards capable of building large vessels. The lead destroyer yard puts the training time for each of these workers at four to five years resulting in the average age of a skilled worker being 55 years old. That is the difference between a workforce that can be surged and one that cannot.
The same collapse runs through the magazine: against the Second World War’s 1.2 million tons of bombs — built faster than its bombers could drop them — the three long-range strike missiles that would decide a Pacific war today, the JASSM, the Tomahawk, and the LRASM, are produced at a combined rate of well under a thousand weapons a year, with the JASSM and LRASM sharing a single production line so that neither can surge without starving the other. A nation that once produced ordnance by the million tons now builds its decisive weapons by the hundreds.7
A Deficit of Time, Not Dollars
This is why the problem is not money. A salary incentive can bid for a welder who already exists; it cannot conjure the decade of schooling, apprenticeship, and yard experience that made him or her, nor rebuild the training system that was scrapped for a peace dividend. The deficit is not in dollars. It is in time, and in institutions that take as long to rebuild as the workers they produce. And they are the kind of worker no surge can produce, because there is no surging a trade that takes ten years to learn. This is the part appropriation cannot fix. Advanced industrial capacity, and submarine construction above all, is not a tap that reopens when the threat returns; surrender it and it is gone for a decade or more, whatever the budget says.
The problems just continue to get worse. Today’s existing ready fleet cannot be fully crewed. The Navy reported 20,683 unfilled billets at sea in December 2025, against a shortage of some 23,000 sailors measured the previous May — and that is the shortfall on a fleet of fewer than 300 ships. The force the Navy says it requires is 381 manned ships, roughly a third larger, every additional hull of which must be crewed from the same recruiting base.
The bottleneck is singular and physical. Every nuclear carrier and submarine in the fleet is maintained at just four public shipyards — Norfolk, Portsmouth, Puget Sound, and Pearl Harbor — most of their dry docks older than the Second World War, and everything queues by priority: ballistic-missile boats first, then carriers, with attack submarines and surface combatants taking whatever berth is left. The consequence is identical whether the hull carries missiles above the waterline or below it. The Congressional Budget Office found in December 2025 that maintenance on the Navy’s conventional warships runs twenty to a hundred percent longer than scheduled, and that an Arleigh Burke destroyer — two-thirds of the surface combatant fleet — will lose an average of nine years to maintenance, a quarter of its hull life and twice what was planned. The undersea picture is older and worse: as far back as 2018 the Government Accountability Office counted more than 8,400 days of maintenance delay across the attack-submarine fleet in a single decade — over twenty-three years of operational time lost — and a further 1,900 days, more than five years, of boats sitting idle in port merely waiting for a berth to open. That backlog has not eased since; it produced the USS Boise, a submarine the Navy gave up and scrapped in 2026 without ever getting it back to sea. A warship that exists but waits years for a yard is, to the fleet that needs it, a warship that is not there.
The relief valve already exists, and Washington is barely turning the tap. Under AUKUS, Australia is building at Henderson and HMAS Stirling precisely the depot-level submarine maintenance capacity the United States most lacks — and paying for it largely itself: some AUD 8 billion to stand up the rotational-force infrastructure at Stirling and a further AUD 12 billion for the Henderson precinct, expressly to deliver contingency docking and depot maintenance. From 2027, up to four American and one British nuclear submarines will rotate through Stirling under Submarine Rotational Force-West, and the concept is already proven in the water: USS Hawaii was worked there in 2024, USS Vermont in 2025, and HMS Anson in early 2026 — the last with tradesmen from Pearl Harbor Naval Shipyard, one of the four choked American yards, lending the very hands it cannot spare at home. This is the answer to the nineteen hundred idle days. Every US boat serviced in Western Australia is a boat that does not wait years for a berth at Norfolk or Pearl Harbor; every Australian submarine tradesman trained at Henderson is one America does not have to grow from scratch against a five-year clock and a workforce already averaging fifty-five. It is the one place in this entire diagnosis where money can still buy time — not by rebuilding a dismantled American training pipeline, which no budget can accelerate, but by renting into capacity an ally has already built. The same logic governs the magazine: the under-funded Pillar II munitions line in Australia is the arsenal’s relief valve as surely as Henderson is the maintenance fleet’s. Australia has the industrial base, the strategic depth, and the proximity to count in a shooting war. That America will not double and triple down on both while the window is open is of a piece with every other unforced error in this assessment — spending like a warring power and building like a peaceful one, even when an ally has offered to build for it.
To meet the Navy’s stated requirements for 2026, the manufacturing workforce must more than double over the next decade — roughly a quarter of a million new skilled hands, more than the entire industry now employs. That figure is the net target; it hides the replacement load beneath it. With the average worker at 55, a large share of the existing 146,000 will retire inside the same decade, so the real task is not training 250,000 but something closer to 320,000 — building two and a half of the current workforce over ten years while the most experienced half of the present one walks out the door. That is roughly 32,000 skilled workers completed every year, each taking four to five years to train, taught by the very tradespeople who are retiring. The funnel that would feed them has been narrowing for forty years: high-school shop classes gone, career-and-technical credits down more than a quarter since the 1980s, precision-production college enrollment falling. The target is not difficult. On the stated timeline it is arithmetically self-contradicting — a workforce that must be trained by the workforce it is replacing, drawn from a pipeline that was dismantled, in trades that take half a decade each to learn, before the ships are needed. The budget can be appropriated tomorrow. The decade cannot.
Ultimately, naval power is not an emergency tap that can be twisted open when a crisis hits the horizon. Advanced industrial capacity and submarine construction are fragile ecosystems; once surrendered, they are gone for a generation, regardless of what the federal budget dictates. The maintenance solution Australia is now building was not a 2026 discovery. As far back as March 2023, NSD assessed that AUKUS’s real and durable value to the United States lay not in the submarines Australia would one day construct, but in the deep-water maintenance capacity it would furnish west of Pearl Harbor — the only secure alternative to an exposed, missile-ranged Guam — and judged that Canberra would be stretched to sustain the Virginias long before it could build them. Three years on, the 30 May 2026 AUKUS ministerial ratified that call: Australia is moving to three in-service Virginias and funding, on its own coin, roughly AUD 20 billion of maintenance and sustainment infrastructure at Stirling and Henderson — the precise depot capacity NSD named. The companion forecast, that the from-scratch SSN-AUKUS builds would slip toward the quiet sidelining that befell the French boats, remains on its predicted decade-long trajectory and is not yet claimed as closed. As long as Washington relies on an industrial base optimized for a post-Cold War peace dividend that expired decades ago, it is playing a losing hand. The crisis of the modern U.S. Navy is not born of a lack of political will or financial capital, but of an unyielding material reality. Long before the first missile is fired in a maritime contest, the math has already made its judgment: the fleet is already sunk on the shop floors of a disappearing industry.
The National Security Desk offers these posts freely, but your support is necessary and appreciated. Please subscribe, paid if you’re able, or leave a tip.
U.S. Navy and Marine carrier combat-aircraft production is aggregated here from individual type totals: fighters (F4U Corsair 12,571; F6F Hellcat 12,275; F4F/FM Wildcat 7,885), dive bombers (SBD Dauntless 5,936; SB2C Helldiver 7,140), and torpedo bombers (TBF/TBM Avenger 9,839) — approximately 55,600 aircraft across six principal types, excluding trainers, patrol aircraft, and transports. Type figures from the Army Air Forces Statistical Digest: World War II (Office of Statistical Control, December 1945) and the Navy Bureau of Aeronautics production records. A precise single “total Navy aircraft” figure is not cleanly separable from the standard production tables, which are organized by aircraft type rather than by procuring service; the figure above is therefore stated as the sum of named combat types rather than as an all-inclusive naval total.
Total U.S. military aircraft acceptances, January 1940–August 1945, were 295,959, of which 200,443 were combat aircraft, the remainder trainers, transports, and support types. The overwhelming majority were accepted under Army Air Forces contracts; the figure includes Navy types, as the official tables do not separate acceptances by service. Source: Army Air Forces Statistical Digest: World War II (Office of Statistical Control, December 1945), grand-total and combat-aircraft tables.
U.S. bomber production, January 1940–August 1945, totaled 96,872 aircraft: 3,740 very heavy (B-29), 31,685 heavy (B-17, B-24), 21,461 medium (B-25, B-26), and 39,986 light bombers. The two heavy types alone — B-24 Liberator (18,493, the most-produced American aircraft of the war) and B-17 Flying Fortress (12,731) — account for over 31,000 four-engine strategic bombers. Source: Army Air Forces Statistical Digest: World War II (Office of Statistical Control, December 1945), production-by-type tables.
U.S. fighter production peaked at 38,848 aircraft in calendar year 1944 (Army Air Forces Statistical Digest: World War II, Office of Statistical Control, December 1945, production-by-type tables). Total U.S. fighter output in 2025 — all manufacturers, all variants, all customers including foreign sales — was approximately 230 aircraft (F-35: 191; F-16: ~20; F-15EX: ~12; F/A-18E/F: 14), and that was an unusually high year inflated by the clearing of a stored F-35 backlog; the sustainable rate is nearer 180–200. At ~230 a year, matching the 1944 total would take roughly 169 years; at the steady-state rate, well over 200. The “forty to fifty years” in the text is therefore conservative, comparing 1944 output against current annual U.S.-fielded fighters (the Pentagon’s own procurement, roughly 70–90 a year, the remainder of production going to allies and export). Sources: Air & Space Forces Magazine and Breaking Defense (2025 delivery figures); F-35 FY2026 U.S. buy cut to 47 aircraft per the same.
U.S. fighter production peaked at 38,848 aircraft in calendar year 1944 (Army Air Forces Statistical Digest: World War II, Office of Statistical Control, December 1945, production-by-type tables). Total U.S. fighter output in 2025 — all manufacturers, all variants, all customers including foreign sales — was approximately 230 aircraft (F-35: 191; F-16: ~20; F-15EX: ~12; F/A-18E/F: 14), and that was an unusually high year inflated by the clearing of a stored F-35 backlog; the sustainable rate is nearer 180–200. At ~230 a year, matching the 1944 total would take roughly 169 years; at the steady-state rate, well over 200. The “forty to fifty years” in the text is therefore conservative, comparing 1944 output against current annual U.S.-fielded fighters (the Pentagon’s own procurement, roughly 70–90 a year, the remainder of production going to allies and export). Sources: Air & Space Forces Magazine and Breaking Defense (2025 delivery figures); F-35 FY2026 U.S. buy cut to 47 aircraft per the same.
World War II bomb expenditure: the U.S. Army Air Forces dropped 1,050,710 tons of bombs on Germany and 179,967 tons on Japan in the strategic bombing campaign alone (U.S. Strategic Bombing Survey, via Encyclopædia Britannica, “Strategic bombing during World War II”); total U.S. expenditure across all theaters, including tactical and naval air, was higher. Current long-range strike-missile production rates: JASSM (AGM-158, air-launched cruise missile) scheduled at 396 for 2026, with a single-line maximum near 860 only if no LRASM is built (Fortune, “U.S. deploys bulk of stealthy long-range missile for Iran war,” 4 April 2026; Shatterbelt, 6 April 2026); Tomahawk (sea-launched cruise missile) averaging roughly 90 a year over the past decade and running under 200 now, against a stated goal of exceeding 1,000 (CSIS, “Rebuilding the U.S. Missile Inventory,” May 2026); LRASM (AGM-158C anti-ship) at roughly 118–240 a year (U.S. Air Force FY2026 budget figures, via Air & Space Forces Magazine, 1 August 2025). JASSM and LRASM are produced on the same line at Lockheed Martin’s Pike County / Troy, Alabama facility, so output of one comes at the expense of the other (Lockheed Martin, “Accelerating Production to Meet Growing Demand,” 2025). Combined annual output of the three systems is therefore well under 1,000 weapons; the CSIS Taiwan war game projects expenditure of up to 5,000 long-range precision missiles in three weeks of fighting.